5.15.5
Practice
5.15.5 • Practice
Complete the following questions to practice the skills you have learned in this lesson.
- Whenever the input of a function increases by 1, the output increases by 5. Which of these equations could define ?
-
-
-
-
- The function is defined by . Which of the following statements is true about the values of ? Select the two statements that apply.
- When the input increases by 1, the value of increases by 2.
- When the input increases by 1, the value of increases by a factor of 2.
- When the input increases by 3, the value of increases by 8.
- When the input increases by 3, the value of increases by a factor of 8.
- When the input increases by 4, the value of increases by a factor of 4.
Use the graph below for questions 3 and 4.
The two lines on the coordinate plane are graphs of functions and .
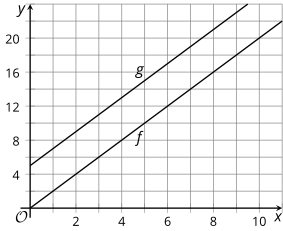
- Use the graph to explain why the value of increases by 2 each time the input increases by 1.
- The -axis counts by 2’s so must increase 2 each time the input increases 1.
- There are two graphs so increases by 2 each time the input increases by 1.
- and are two points on the graph of . Between the two points, increases by 2 and increases by 1.
- does not increase by 2 each time increases by 1.
- Use the graph to explain why the value of increases by 2 each time the input increases by 1. Select two that apply.
- and never intersect and stay an equal distance apart. increases by 2 every time increases by 1, so must do so as well.
- You can’t use the graph because the points are not labeled.
- There are two graphs so increases by 2 each time the input increases by 1.
- and are points on the graph of . Between the two points, increases by 2 and increases by 1.
- and are two points on the graph of . Between the two points, increases by 2 and increases by 1.
- The function is given by . Find the quotient .
- The function is given by . Find the quotient .
-
125
-
25
-
15
-
5
- For each of the functions , and , the domain is . For which functions is the average rate of change a good measure of how the function changes for this domain? Select three that apply.
- What would be the rate of change of the following table?
|
|
| 1 |
-4 |
| 2 |
-2 |
| 3 |
0 |
| 4 |
2 |
| 5 |
4 |
- Given the following table, what would be ?
|
|
| 1 |
2 |
| 2 |
4 |
| 3 |
8 |
| 4 |
16 |
| 5 |
32 |
- Which of the following statements compare rates of and ?
-
In you add 3 to get to the next term; in you multiply by 3 to get to the next term.
-
In you add 3 to get to the next term; in you multiply by 3 to get to the next term.
-
In and you add 3 to get to the next term.
-
In and you multiply by 3 to get to the next term.