Practice

3.2.6 Practice

3.2.6 • Practice

Complete the following questions to practice the skills you have learned in this lesson.

  1. Use graphing technology to create a scatter plot and find the best fit line.

What does the best fit line estimate for the y-value when x is 100?

x y
83 102
87 115
91 107
93 122
97 125
97 127
101 120
104 127
  1. 120
  2. 150
  3. 125
  4. 100
  1. A seed is planted in a glass pot, and its height is measured in centimeters every day.
A scatter plot. Horizontal, 0 to 30, by 1’s, labeled days. Vertical, negative 5 to 3, by point 5’s, labeled height in centimeters. 21 dots trend linearly up and to the right with a line a best fit.

The best fit line is given by the equation y = 0.404 x − 5.18 , where y represents the height of the plant above ground level, and x represents the number of days since it was planted.

What is the slope of the best fit line? What does the slope of the line mean in this situation?

  1. The slope is 0.404 , which means the plant grows 1 centimeter every 0.404 days.
  2. The slope is − 5.18 , which means for every day, the plant shrinks − 5.18 centimeters.
  3. The slope is 0.404 , which means for every day, the plant grows 0.404 centimeters.
  4. The slope is 5.18 , which means for every day, the plant grows 5.18 centimeters.

Use the following information to answer questions 3 - 5.

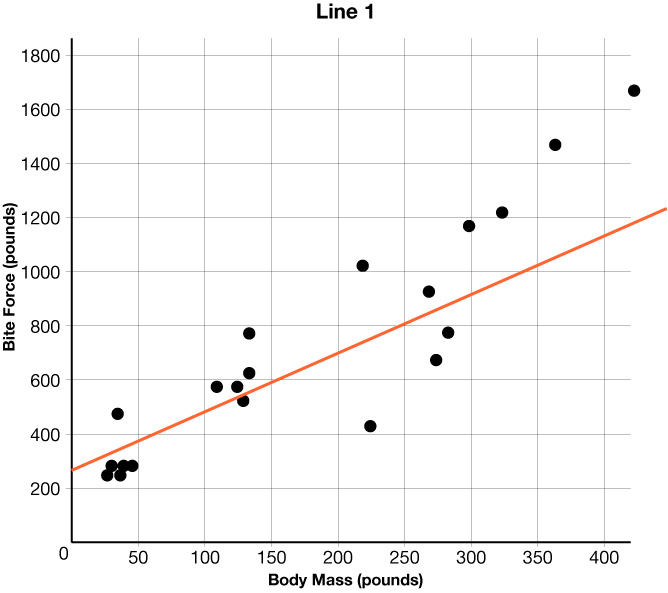
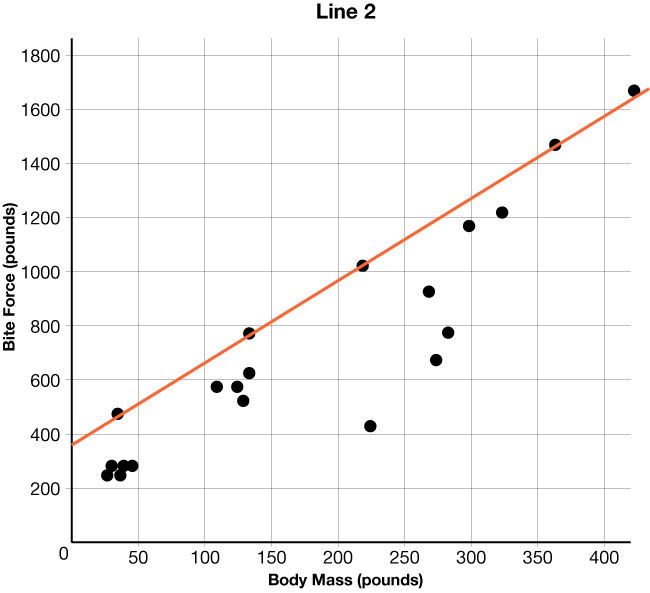
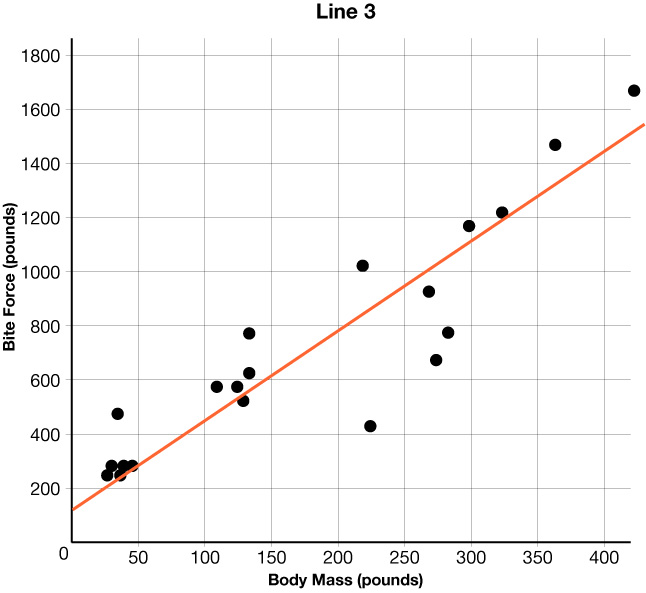
The scatter plots below show different lines that students used to model the relationship between body mass (in pounds) and bite force (in pounds) for crocodiles.

Match each graph to one of the equations below, and explain your reasoning. Let B represent bite force (in pounds) and W represent body mass (in pounds).

A SCATTER PLOT THAT SHOWS BODY MASS IN POUNDS ON THE X-AXIS AND BITE FORCE IN POUNDS ON THE Y-AXIS. THE LINE DRAWN INCREASES FROM LEFT TO RIGHT AND HAS A y-intercepts BETWEEN 200 AND 300. A SCATTER PLOT THAT SHOWS BODY MASS IN POUNDS ON THE X-AXIS AND BITE FORCE IN POUNDS ON THE Y-AXIS. THE LINE DRAWN INCREASES FROM LEFT TO RIGHT AND HAS A y-intercepts BETWEEN 300 AND 400. A SCATTER PLOT THAT SHOWS BODY MASS IN POUNDS ON THE X-AXIS AND BITE FORCE IN POUNDS ON THE Y-AXIS. THE LINE DRAWN INCREASES FROM LEFT TO RIGHT AND HAS A y-intercepts BETWEEN 100 AND 200.

  1. Which graph represents data that could be modeled by the equation, B = 3.28 W + 126 ?
  1. Line 1
  2. Line 2
  3. Line 3
  1. Which graph represents data that could be modeled by the equation, B = 3.04 W + 351 ?
  1. Line 1
  2. Line 2
  3. Line 3
  1. Which graph represents data that could be modeled by the equation, B = 2.16 W + 267 ?
  1. Line 1
  2. Line 2
  3. Line 3
  1. Mike owns a grass cutting business. The table below shows how many yards, y , he can cut in x days.
Number of days, x 1 2 3 4
Number of yards cut, y 6 12 18 24
  1. y = 1 6 x + 6
  2. y = 1 6 x
  3. y = 6 x + 6
  4. y = 6 x