3.3.3 Matching Residuals Graphs to Scatter Plots
3.3.3 • Matching Residuals Graphs to Scatter Plots
Activity
With a partner, you will take turns to match the graphs of residuals to the scatter plots that display linear models. The scatter plots and their lines of best fit are located on cards A - F. The graphs of the residuals are located on cards G - L.
Match the scatter plots and given linear models to the graph of the residuals.
Check your answer:
- A matches with K
- B matches with G
- C matches with L
- D matches with H
- E matches with J
- F matches with I
Turn over the scatter plots so that only the residuals are visible. Based on the residuals, which line would produce the most accurate estimates? Which line fits its data worst?
Compare your answers:
B fits its data the best. C or E fits its data the worst.
What Do Residual Plots Tell Us?
Residuals tell us how close to accurate a line of best fit really is.
Ideally, the residual from a line of best fit will be scattered randomly above and below the horizontal line on the residual plot. The residual plot would have points above and below the horizontal line . This shows that the relationship between the two variables in the data set can be approximated by a linear model.
When the residuals are equal to 0, this indicates that the line of best fit goes through those points.
A curved pattern shows that a nonlinear model would be better to describe the relationships between points.
Are you ready for more?
Extending Your Thinking
Use the following information to answer questions 1 – 2.
Tyler estimates a line of best fit for some linear data about the mass, in grams, of different numbers of apples. Here is the graph of the residuals.
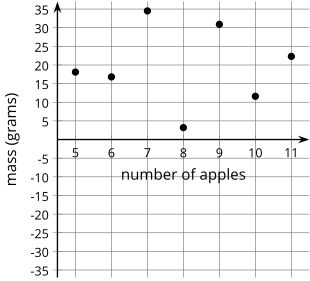
What does Tyler’s line of best fit look like according to the graph of the residuals?
Compare your answer:
The data are between 10 and 30 grams above the line of best fit.
How well does Tyler’s line of best fit model the data? Be prepared to show your reasoning.
Compare your answer:
Tyler’s line does not model the data well because all of the residuals are positive.
Use the following information to answer questions 3 and 4.
Lin estimates a line of best fit for the same data. The graph shows the residuals.
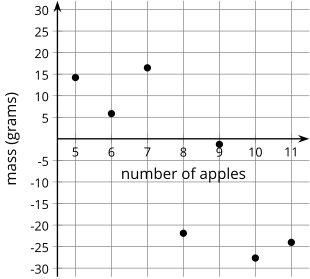
What does Lin’s line of best fit look like in comparison to the data?
Compare your answer:
The line is below the lower half of the data and above the second half of the data.
How well does Lin’s line of best fit model the data? Be prepared to show your reasoning.
Compare your answer:
It is not a good fit because the first several residuals are all positive and the last several residuals are negative. They should not have a pattern if the line of best fit is good.
Use the following information to answer questions 5 – 6.
Kiran also estimates a line of best fit for the same data. The graph shows the residuals.
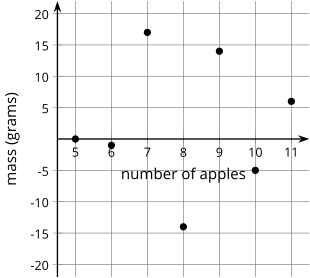
What does Kiran’s line of best fit look like in comparison to the data?
Compare your answer:
Your answer may vary, but here is a sample. Kiran’s line appears to go through the middle of the data with some points above and some points below the line.
How well does Kiran’s line of best fit model the data? Be prepared to show your reasoning.
Compare your answer:
Kiran’s line of best fit is a good one because it appears to pass through the middle of the data.
Who has the best estimate of the line of best fit: Tyler, Lin, or Kiran? Be prepared to show your reasoning.
Compare your answer:
Kiran’s line of best fit is the best because the graph of the residuals lets me know that some points are above the line of best fit and some are below. In addition, two of the residuals are close to 0, so that indicates that the line passes through or near those 2 points. Tyler's line of best fit is not a good one because it is above all the data. Lin’s line of best fit is below all the lower data values and above all the high data values, so it is not a good fit.
Self Check
Additional Resources
The Meaning of Residuals
Suppose that you have a scatter plot and that you have drawn the line of best fit on your plot. Remember that the residual for a point in the scatter plot is the vertical distance of that point from the line of best fit. In the previous lesson, you looked at a scatter plot showing how fuel efficiency was related to curb weight for five compact cars. The scatter plot and line of best fit are shown below.
Consider the following questions:
- What kind of residual does Point A have?
- Point A has a large positive residual.
- What kind of residual does Point B have?
- Point B has a small positive residual.
- What kind of residual does Point C have?
- Point C has a very large negative residual.
Try it
The Meaning of Residuals
Suppose you are given a scatter plot and a line of best fit that looks like this:
Describe what you think the residual plot would look like.
Compare your answer:
Here is how to sketch the residual plot:
Moving from left to right, the points initially tend to be below the line of best fit, then move above it, and then below it. The residuals are negative, then positive, and then negative again. This means that the points in the residual plot will be below the horizontal axis, then above it, and then below it again.
The residual plot has an arch shape like this: