1.10.4 Matching Equations and Graphs
1.10.4 • Matching Equations and Graphs
Cool Down
Kiran is spending $12 on games and rides at another carnival, where a game costs $0.25 and a ride costs $1.
1.
Write an equation to represent the relationship between the dollar amount Kiran is spending and the number of games, , and the number of rides, , he could do.
Compare your answer:
2.
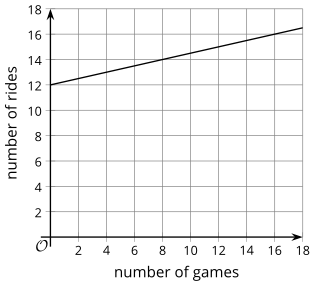
Which graph represents the relationship between the quantities in this situation?
A.
B.
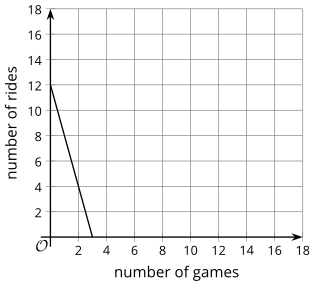
C.
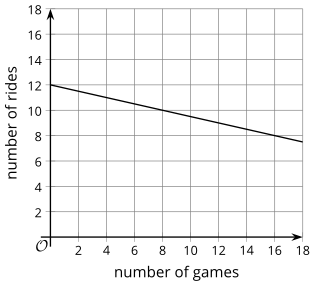
Compare your answer:
Graph C (for )
3.
Explain how you determined your answer to the previous question.
Compare your answer: Your answer may vary, but here are some samples.
- If Kiran plays 0 games, he could get on 12 rides. If he gets on 0 rides, he could play 48 games. Both the points (0,12) and (48,0) are on the line in Graph C.
- Rearranging the equation into slope-intercept form gives , so the graph has a slope of and intersects the -axis at 12, which matches Graph C.