3.2.5 Working with Fitted Lines
3.2.5 • Working with Fitted Lines
Cool Down
1.
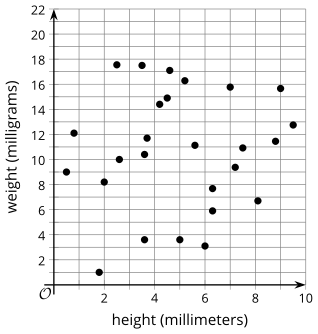
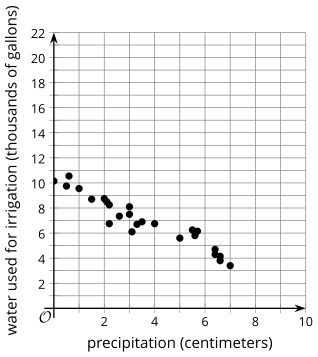
Which of these scatter plots shows data that would best be modeled with a linear function? Be prepared to show your reasoning.
Graph A
Graph B
Compare your answer:
Graph B. Your answer may vary, but here is a sample. The points in scatter plot B seem to follow the shape of a line of best fit. The points in scatter plot in A are very spread out.
2.
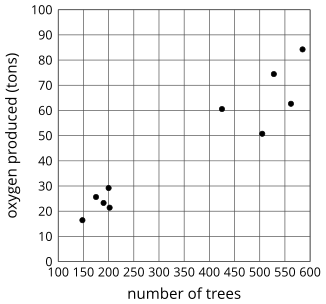
Which of the following lines is most likely the line of best fit for the data provided in the graph and table below?
| number of trees in a forest | tons of oxygen produced by the forest |
|---|---|
| 148 | 16.43 |
| 175 | 25.64 |
| 190 | 23.28 |
| 200 | 29.2 |
| 202 | 21.41 |
| 425 | 60.56 |
| 505 | 50.75 |
| 528 | 74.45 |
| 562 | 62.66 |
| 585 | 84.24 |
Compare your answer: