2.11.4 Shading Boundary Line Regions
2.11.4 • Shading Boundary Line Regions
Cool Down
1.
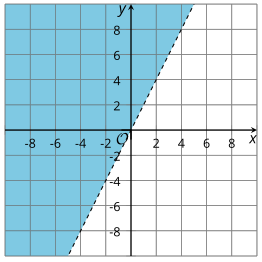
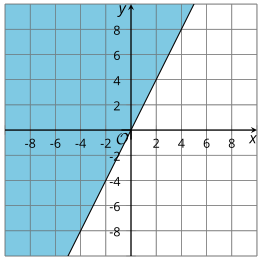
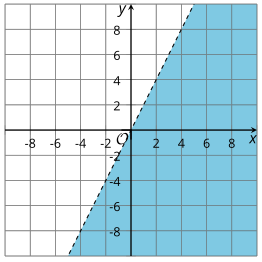
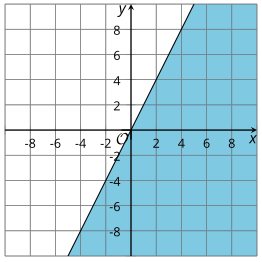
The line in each shaded graph represents . Which graph including the shaded region represents ?
A.
B.
C.
D.
Compare your answer:
Graph C
2.
Explain your reasons for choosing that graph.
Compare your answer:
Compare your answer: Your answer may vary, but here is a sample. I substituted the coordinates of a few points above the line into the inequality and found that they are all not solutions. The point , which is on the line, is also not a solution. I concluded that the points on and above the line are not solutions, and the region below the line represents the solutions.