3.3.5
Practice
3.3.5 • Practice
Complete the following questions to practice the skills you have learned in this lesson.
Using the following information, find the residual for each of the coordinate pairs, in 1 - 6.
A line of best fit for a data set is .
-
-2.76
-
0
-
0.32
-
-0.2
-
-0.1
- In the scatter plot below, the length of fish and the age of the fish are shown. The residual for the fish that is 2 years old and 100 mm long is 8.06 mm.
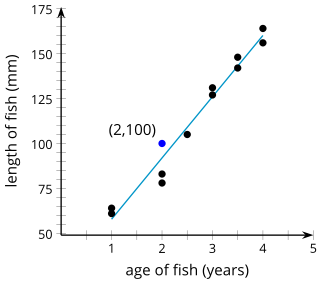
What does this residual mean?
-
The actual fish at 2 years old is about 8 mm shorter than the linear model estimates.
-
The actual fish at 2 years old is about 8 mm longer than the linear model estimates.
Use the following information to answer questions 8 – 11.
Four athletes on a track team are comparing their personal bests in the 100-meter and 200-meter events. A table of their best times is shown below.
| Athlete |
100 m time
(seconds) |
200 m time
(seconds) |
|
1
|
12.95
|
26.68
|
|
2
|
13.81
|
29.48
|
|
3
|
14.66
|
28.11
|
|
4
|
14.88
|
30.93
|
The line of best fit has an equation of , where represents the 100-meter time and represents the 200-meter time.
- What is the residual for athlete number 1?
-
-
-
-
-
-
-
-
- What is the residual for athlete number 2?
-
-
-
-
-
-
-
-
- What is the residual for athlete number 3?
-
-
-
-
-
-
-
-
- What is the residual for athlete number 4?
-
-
-
-
-
-
-
-
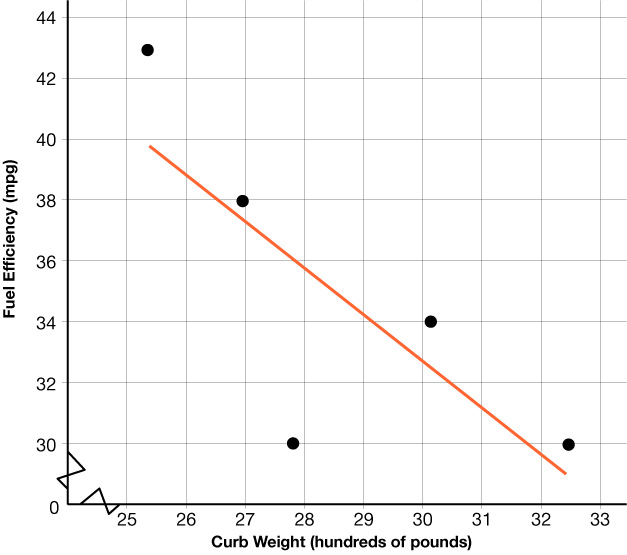
- The curb weight of a car is the weight of the car without luggage or passengers. The scatter plot below shows the curb weight, in pounds, of 5 cars and their fuel efficiency, in miles per gallon.
Will the residual for 25.33 be a positive or negative value?
-
positive
-
negative