Chapter 8

Chapter 8

Try It

8.1 The Ellipse

1.

x 2 + y 2 16 =1 x 2 + y 2 16 =1

2.

( x−1 ) 2 16 + ( y−3 ) 2 4 =1 ( x−1 ) 2 16 + ( y−3 ) 2 4 =1

3.

center: ( 0,0 ); ( 0,0 ); vertices: ( ±6,0 ); ( ±6,0 ); co-vertices: ( 0,±2 ); ( 0,±2 ); foci: ( ±4 2 ,0 ) ( ±4 2 ,0 )

A Cartesian coordinate system shows an ellipse centered at the origin (0,0). The major axis is horizontal, with vertices at (-6, 0) and (6, 0). The minor axis is vertical, with y-intercepts at (0, 2) and (0, -2). The foci of the ellipse are located at (-4√2, 0) and (4√2, 0).
4.

Standard form: x 2 16 + y 2 49 =1; x 2 16 + y 2 49 =1; center: ( 0,0 ); ( 0,0 ); vertices: ( 0,±7 ); ( 0,±7 ); co-vertices: ( ±4,0 ); ( ±4,0 ); foci: ( 0,± 33 ) ( 0,± 33 )

A coordinate plane shows an ellipse centered at (4, 2). Its major axis extends horizontally from (-2, 2) to (10, 2), and its minor axis extends vertically from (4, 2 - 2sqrt(5)) to (4, 2 + 2sqrt(5)).
5.

Center: ( 4,2 ); ( 4,2 ); vertices: ( −2,2 ) ( −2,2 ) and ( 10,2 ); ( 10,2 ); co-vertices: ( 4,2−2 5 ) ( 4,2−2 5 ) and ( 4,2+2 5 ); ( 4,2+2 5 ); foci: ( 0,2 ) ( 0,2 ) and ( 8,2 ) ( 8,2 )

A graph of an ellipse centered at (4, 2) on a Cartesian coordinate system. The horizontal major axis extends from (-2, 2) to (10, 2), and the vertical minor axis from (4, 2 - 2
5) to (4, 2 + 2
5). Foci are at (0, 2) and (8, 2).
6.

(x−3) 2 4 + ( y+1 ) 2 16 =1; (x−3) 2 4 + ( y+1 ) 2 16 =1; center: ( 3,−1 ); ( 3,−1 ); vertices: ( 3,−5 ) ( 3,−5 ) and ( 3,3 ); ( 3,3 ); co-vertices: ( 1,−1 ) ( 1,−1 ) and ( 5,−1 ); ( 5,−1 ); foci: ( 3,−1−2 3 ) ( 3,−1−2 3 ) and ( 3,−1+2 3 ) ( 3,−1+2 3 )

7.
  1. ⓐ x 2 57,600 + y 2 25,600 =1 x 2 57,600 + y 2 25,600 =1
  2. ⓑ The people are standing 358 feet apart.

8.2 The Hyperbola

1.

Vertices: ( ±3,0 ); ( ±3,0 ); Foci: ( ± 34 ,0 ) ( ± 34 ,0 )

2.

y 2 4 − x 2 16 =1 y 2 4 − x 2 16 =1

3.

( y−3 ) 2 25 - ( x−1 ) 2 144 =1 ( y−3 ) 2 25 - ( x−1 ) 2 144 =1

4.

vertices: ( ±12,0 ); ( ±12,0 ); co-vertices: ( 0,±9 ); ( 0,±9 ); foci: ( ±15,0 ); ( ±15,0 ); asymptotes: y=± 3 4 x; y=± 3 4 x;

A hyperbola centered at the origin with vertices (±12, 0), foci (±15, 0), and asymptotes y = ±(3/4)x. Points (0, ±9) are on the conjugate axis.
5.

center: ( 3,−4 ); ( 3,−4 ); vertices: ( 3,−14 ) ( 3,−14 ) and ( 3,6 ); ( 3,6 ); co-vertices: ( −5,−4 ); ( −5,−4 ); and ( 11,−4 ); ( 11,−4 ); foci: ( 3,−4−2 41 ) ( 3,−4−2 41 ) and ( 3,−4+2 41 ); ( 3,−4+2 41 ); asymptotes: y=± 5 4 ( x−3 )−4 y=± 5 4 ( x−3 )−4

A graph depicts a hyperbola opening along the y-axis, centered at the point (3, -4). The upper branch has a vertex at (3, 6) and a focus at (3, -4 + 2 sqrt(41)). The lower branch has a vertex at (3, -14) and a focus at (3, -4 - 2 sqrt(41)). The asymptotes are represented by dashed orange lines with equations y = (5/4)(x-3)-4 and y = -(5/4)(x-3)-4. A horizontal dashed blue line passes through the center at y = -4, with points (-5, -4) and (11, -4) marked on it. A vertical dashed red line passes through the center at x = 3, intersecting the vertices and foci.
6.

The sides of the tower can be modeled by the hyperbolic equation. x 2 400 − y 2 3600 =1or  x 2 20 2 − y 2 60 2 =1. x 2 400 − y 2 3600 =1or  x 2 20 2 − y 2 60 2 =1.

8.3 The Parabola

1.

Focus: ( −4,0 ); ( −4,0 ); Directrix: x=4; x=4; Endpoints of the latus rectum: ( −4,±8 ) ( −4,±8 )

A graph displays the parabola y^2 = -16x. Its vertex is at (0, 0), the focus at (-4, 0), and the directrix is the line x = 4. Points (-4, 8) and (-4, -8) are shown on the parabola.
2.

Focus: ( 0,2 ); ( 0,2 ); Directrix: y=−2; y=−2; Endpoints of the latus rectum: ( ±4,2 ). ( ±4,2 ).

The graph of the parabola x^2=8y, centered at the origin (0,0), with its focus at (0,2) and directrix at y=-2. The points (-4,2) and (4,2) on the parabola are also indicated.
3.

x 2 =14y. x 2 =14y.

4.

Vertex: ( 8,−1 ); ( 8,−1 ); Axis of symmetry: y=−1; y=−1; Focus: ( 9,−1 ); ( 9,−1 ); Directrix: x=7; x=7; Endpoints of the latus rectum: ( 9,−3 ) ( 9,−3 ) and ( 9,1 ). ( 9,1 ).

Graph of the parabola (y+1)^2 = -4(x-8) opening left. Vertex (8, -1), focus (9, -1), and directrix x=7 are labeled, along with points (9, 1) and (9, -3) on the curve.
5.

Vertex: ( −2,3 ); ( −2,3 ); Axis of symmetry: x=−2; x=−2; Focus: ( −2,−2 ); ( −2,−2 ); Directrix: y=8; y=8; Endpoints of the latus rectum: ( −12,−2 ) ( −12,−2 ) and ( 8,−2 ). ( 8,−2 ).

A graph of a downward-opening parabola with equation (x+2)^2 = -20(y-3). Its vertex is at (-2, 3), axis of symmetry x = -2, focus at (-2, -2), and directrix y = 8.
6.
  1. ⓐ y 2 =1280x y 2 =1280x
  2. ⓑ The depth of the cooker is 500 mm

8.4 Rotation of Axes

1.
  1. ⓐ hyperbola
  2. ⓑ ellipse
2.

x ′ 2 4 + y ′ 2 1 =1 x ′ 2 4 + y ′ 2 1 =1

3.
  1. ⓐ hyperbola
  2. ⓑ ellipse

8.5 Conic Sections in Polar Coordinates

1.

ellipse; e= 1 3 ;x=−2 e= 1 3 ;x=−2

2.
A two-dimensional Cartesian coordinate system displays a dark blue circle. The x-axis is labeled 'x' and ranges from -0.5 to 1, with tick marks every 0.25. The y-axis is labeled 'y' and ranges from -0.75 to 0.75, with tick marks every 0.25. The circle is centered at (0.25, 0) and has a radius of 0.5, extending from x = -0.25 to x = 0.75 and from y = -0.5 to y = 0.5.
3.

r= 1 1−cosθ r= 1 1−cosθ

4.

4−8x+3 x 2 − y 2 =0 4−8x+3 x 2 − y 2 =0

8.1 Section Exercises

1.

An ellipse is the set of all points in the plane the sum of whose distances from two fixed points, called the foci, is a constant.

3.

This special case would be a circle.

5.

It is symmetric about the x-axis, y-axis, and the origin.

7.

yes; x 2 3 2 + y 2 2 2 =1 x 2 3 2 + y 2 2 2 =1

9.

yes; x 2 ( 1 2 ) 2 + y 2 ( 1 3 ) 2 =1 x 2 ( 1 2 ) 2 + y 2 ( 1 3 ) 2 =1

11.

x 2 2 2 + y 2 7 2 =1; x 2 2 2 + y 2 7 2 =1; Endpoints of major axis ( 0,7 ) ( 0,7 ) and ( 0,−7 ). ( 0,−7 ). Endpoints of minor axis ( 2,0 ) ( 2,0 ) and ( −2,0 ). ( −2,0 ). Foci at ( 0,3 5 ),( 0,−3 5 ). ( 0,3 5 ),( 0,−3 5 ).

13.

x 2 ( 1 ) 2 + y 2 ( 1 3 ) 2 =1; x 2 ( 1 ) 2 + y 2 ( 1 3 ) 2 =1; Endpoints of major axis ( 1,0 ) ( 1,0 ) and ( −1,0 ). ( −1,0 ). Endpoints of minor axis ( 0, 1 3 ),( 0,− 1 3 ). ( 0, 1 3 ),( 0,− 1 3 ). Foci at ( 2 2 3 ,0 ),( − 2 2 3 ,0 ). ( 2 2 3 ,0 ),( − 2 2 3 ,0 ).

15.

( x−2 ) 2 7 2 + ( y−4 ) 2 5 2 =1; ( x−2 ) 2 7 2 + ( y−4 ) 2 5 2 =1; Endpoints of major axis ( 9,4 ),( −5,4 ). ( 9,4 ),( −5,4 ). Endpoints of minor axis ( 2,9 ),( 2,−1 ). ( 2,9 ),( 2,−1 ). Foci at ( 2+2 6 ,4 ),( 2−2 6 ,4 ). ( 2+2 6 ,4 ),( 2−2 6 ,4 ).

17.

( x+5 ) 2 2 2 + ( y−7 ) 2 3 2 =1; ( x+5 ) 2 2 2 + ( y−7 ) 2 3 2 =1; Endpoints of major axis ( −5,10 ),( −5,4 ). ( −5,10 ),( −5,4 ). Endpoints of minor axis ( −3,7 ),( −7,7 ). ( −3,7 ),( −7,7 ). Foci at ( −5,7+ 5 ),( −5,7− 5 ). ( −5,7+ 5 ),( −5,7− 5 ).

19.

( x−1 ) 2 3 2 + ( y−4 ) 2 2 2 =1; ( x−1 ) 2 3 2 + ( y−4 ) 2 2 2 =1; Endpoints of major axis ( 4,4 ),( −2,4 ). ( 4,4 ),( −2,4 ). Endpoints of minor axis ( 1,6 ),( 1,2 ). ( 1,6 ),( 1,2 ). Foci at ( 1+ 5 ,4 ),( 1− 5 ,4 ). ( 1+ 5 ,4 ),( 1− 5 ,4 ).

21.

( x−3 ) 2 ( 3 2 ) 2 + ( y−5 ) 2 ( 2 ) 2 =1; ( x−3 ) 2 ( 3 2 ) 2 + ( y−5 ) 2 ( 2 ) 2 =1; Endpoints of major axis ( 3+3 2 ,5 ),( 3−3 2 ,5 ). ( 3+3 2 ,5 ),( 3−3 2 ,5 ). Endpoints of minor axis ( 3,5+ 2 ),( 3,5− 2 ). ( 3,5+ 2 ),( 3,5− 2 ). Foci at ( 7,5 ),( −1,5 ). ( 7,5 ),( −1,5 ).

23.

( x+5 ) 2 ( 5 ) 2 + ( y−2 ) 2 ( 2 ) 2 =1; ( x+5 ) 2 ( 5 ) 2 + ( y−2 ) 2 ( 2 ) 2 =1; Endpoints of major axis ( 0,2 ),( −10,2 ). ( 0,2 ),( −10,2 ). Endpoints of minor axis ( −5,4 ),( −5,0 ). ( −5,4 ),( −5,0 ). Foci at ( −5+ 21 ,2 ),( −5− 21 ,2 ). ( −5+ 21 ,2 ),( −5− 21 ,2 ).

25.

( x+3 ) 2 ( 5 ) 2 + ( y+4 ) 2 ( 2 ) 2 =1; ( x+3 ) 2 ( 5 ) 2 + ( y+4 ) 2 ( 2 ) 2 =1; Endpoints of major axis ( 2,−4 ),( −8,−4 ). ( 2,−4 ),( −8,−4 ). Endpoints of minor axis ( −3,−2 ),( −3,−6 ). ( −3,−2 ),( −3,−6 ). Foci at ( −3+ 21 ,−4 ),( −3− 21 ,−4 ). ( −3+ 21 ,−4 ),( −3− 21 ,−4 ).

27.

Foci ( −3,−1+ 11 ),( −3,−1− 11 ) ( −3,−1+ 11 ),( −3,−1− 11 )

29.

Focus ( 0,0 ) ( 0,0 )

31.

Foci ( −10,30 ),( −10,−30 ) ( −10,30 ),( −10,−30 )

33.

Center ( 0,0 ), ( 0,0 ), Vertices ( 4,0 ),( −4,0 ),(0,3),(0,−3), ( 4,0 ),( −4,0 ),(0,3),(0,−3), Foci ( 7 ,0 ),( − 7 ,0 ) ( 7 ,0 ),( − 7 ,0 )

A Cartesian coordinate system displays an ellipse centered at the origin, with x-axis extending from -4 to 4 and y-axis from -3 to 3.
35.

Center ( 0,0 ), ( 0,0 ), Vertices ( 1 9 ,0 ),( − 1 9 ,0 ),( 0, 1 7 ),( 0,− 1 7 ), ( 1 9 ,0 ),( − 1 9 ,0 ),( 0, 1 7 ),( 0,− 1 7 ), Foci ( 0, 4 2 63 ),( 0,− 4 2 63 ) ( 0, 4 2 63 ),( 0,− 4 2 63 )

A graph shows an upright ellipse centered at the origin. The x-axis spans from -0.3 to 0.3, and the y-axis from -0.2 to 0.2. The ellipse's approximate x-intercepts are +/- 0.1 and y-intercepts are +/- 0.15.
37.

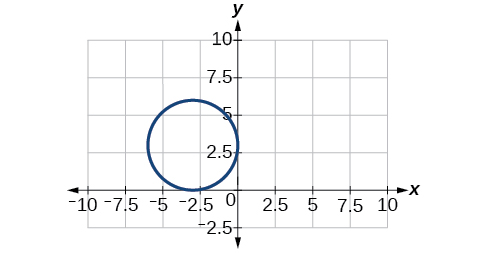
Center ( −3,3 ), ( −3,3 ), Vertices ( 0,3 ),( −6,3 ),( −3,0 ),( −3,6 ), ( 0,3 ),( −6,3 ),( −3,0 ),( −3,6 ), Focus ( −3,3 ) ( −3,3 )

Note that this ellipse is a circle. The circle has only one focus, which coincides with the center.

A blue circle is plotted on a Cartesian coordinate system. The x-axis ranges from -10 to 10, and the y-axis from -2.5 to 10. The circle is centered at (-2.5, 2.5) with a radius of 2.5 units.
39.

Center ( 1,1 ), ( 1,1 ), Vertices ( 5,1 ),( −3,1 ),( 1,3 ),( 1,−1 ), ( 5,1 ),( −3,1 ),( 1,3 ),( 1,−1 ), Foci (1+23,1), (1-23,1) (1+23,1), (1-23,1)

An ellipse is displayed on a Cartesian coordinate plane with x and y axes ranging from -5 to 5. The ellipse is horizontally elongated, centered at (1,1).
41.

Center ( −4,5 ), ( −4,5 ), Vertices ( −2,5 ),( −6,5 ),( −4,6 ),( −4,4 ), ( −2,5 ),( −6,5 ),( −4,6 ),( −4,4 ), Foci ( −4+ 3 ,5 ),( −4− 3 ,5 ) ( −4+ 3 ,5 ),( −4− 3 ,5 )

An ellipse is plotted on a Cartesian coordinate system. The x-axis ranges from -10 to 2.5, with major ticks at -10, -7.5, -5, -2.5, 0, and 2.5. The y-axis ranges from -2.5 to 10, with major ticks at -2.5, 0, 2.5, 5, 7.5, and 10. The ellipse is centered approximately at (-4, 5) and is horizontally elongated, extending from about x=-6 to x=-2.5 and vertically from about y=4 to y=6.
43.

Center ( −2,1 ), ( −2,1 ), Vertices ( 0,1 ),( −4,1 ),( −2,5 ),( −2,−3 ), ( 0,1 ),( −4,1 ),( −2,5 ),( −2,−3 ), Foci ( −2,1+2 3 ),( −2,1−2 3 ) ( −2,1+2 3 ),( −2,1−2 3 )

A graph displays a blue, vertically oriented ellipse centered around (-1, 2) on a Cartesian coordinate plane. The x-axis ranges from -5 to 2.5, and the y-axis from -5 to 7.5.
45.

Center ( −2,−2 ), ( −2,−2 ), Vertices ( 0,−2 ),( −4,−2 ),( −2,0 ),( −2,−4 ), ( 0,−2 ),( −4,−2 ),( −2,0 ),( −2,−4 ), Focus ( −2,−2 ) ( −2,−2 )

A graph displays a circle on a coordinate plane. The circle is centered at (-2, -2) and has a radius of 2, passing through points such as (-4, -2), (0, -2), (-2, 0), and (-2, -4).
47.

x 2 25 + y 2 29 =1 x 2 25 + y 2 29 =1

49.

( x−4 ) 2 25 + ( y−2 ) 2 1 =1 ( x−4 ) 2 25 + ( y−2 ) 2 1 =1

51.

( x+3 ) 2 16 + ( y−4 ) 2 4 =1 ( x+3 ) 2 16 + ( y−4 ) 2 4 =1

53.

x 2 81 + y 2 9 =1 x 2 81 + y 2 9 =1

55.

( x+2 ) 2 4 + ( y−2 ) 2 9 =1 ( x+2 ) 2 4 + ( y−2 ) 2 9 =1

57.

Area = 12πsquareunits Area = 12πsquareunits

59.

Area = 2 5 π Area = 2 5 π square units.

61.

Area = 9π Area = 9π square units.

63.

x 2 4 h 2 + y 2 1 4 h 2 =1 x 2 4 h 2 + y 2 1 4 h 2 =1

65.

x 2 400 + y 2 144 =1 x 2 400 + y 2 144 =1 . Distance = 17.32 feet

67.

Approximately 51.96 feet

8.2 Section Exercises

1.

A hyperbola is the set of points in a plane the difference of whose distances from two fixed points (foci) is a positive constant.

3.

The foci must lie on the transverse axis and be in the interior of the hyperbola.

5.

The center must be the midpoint of the line segment joining the foci.

7.

yes x 2 6 2 − y 2 3 2 =1 x 2 6 2 − y 2 3 2 =1

9.

yes x 2 4 2 − y 2 5 2 =1 x 2 4 2 − y 2 5 2 =1

11.

x 2 5 2 − y 2 6 2 =1; x 2 5 2 − y 2 6 2 =1; vertices: ( 5,0 ),( −5,0 ); ( 5,0 ),( −5,0 ); foci: ( 61 ,0 ),( − 61 ,0 ); ( 61 ,0 ),( − 61 ,0 ); asymptotes: y= 6 5 x,y=− 6 5 x y= 6 5 x,y=− 6 5 x

13.

y 2 2 2 − x 2 9 2 =1; y 2 2 2 − x 2 9 2 =1; vertices: ( 0,2 ),( 0,−2 ); ( 0,2 ),( 0,−2 ); foci: ( 0, 85 ),( 0,− 85 ); ( 0, 85 ),( 0,− 85 ); asymptotes: y= 2 9 x,y=− 2 9 x y= 2 9 x,y=− 2 9 x

15.

( x−1 ) 2 3 2 − ( y−2 ) 2 4 2 =1; ( x−1 ) 2 3 2 − ( y−2 ) 2 4 2 =1; vertices: ( 4,2 ),( −2,2 ); ( 4,2 ),( −2,2 ); foci: ( 6,2 ),( −4,2 ); ( 6,2 ),( −4,2 ); asymptotes: y= 4 3 ( x−1 )+2,y=− 4 3 ( x−1 )+2 y= 4 3 ( x−1 )+2,y=− 4 3 ( x−1 )+2

17.

( x−2 ) 2 7 2 − ( y+7 ) 2 7 2 =1; ( x−2 ) 2 7 2 − ( y+7 ) 2 7 2 =1; vertices: ( 9,−7 ),( −5,−7 ); ( 9,−7 ),( −5,−7 ); foci: ( 2+7 2 ,−7 ),( 2−7 2 ,−7 ); ( 2+7 2 ,−7 ),( 2−7 2 ,−7 ); asymptotes: y=x−9,y=−x−5 y=x−9,y=−x−5

19.

( x+3 ) 2 3 2 − ( y−3 ) 2 3 2 =1; ( x+3 ) 2 3 2 − ( y−3 ) 2 3 2 =1; vertices: ( 0,3 ),( −6,3 ); ( 0,3 ),( −6,3 ); foci: ( −3+3 2 ,1 ),( −3−3 2 ,1 ); ( −3+3 2 ,1 ),( −3−3 2 ,1 ); asymptotes: y=x+6,y=−x y=x+6,y=−x

21.

( y−4 ) 2 2 2 − ( x−3 ) 2 4 2 =1; ( y−4 ) 2 2 2 − ( x−3 ) 2 4 2 =1; vertices: ( 3,6 ),( 3,2 ); ( 3,6 ),( 3,2 ); foci: ( 3,4+2 5 ),( 3,4−2 5 ); ( 3,4+2 5 ),( 3,4−2 5 ); asymptotes: y= 1 2 ( x−3 )+4,y=− 1 2 ( x−3 )+4 y= 1 2 ( x−3 )+4,y=− 1 2 ( x−3 )+4

23.

( y+5 ) 2 7 2 − ( x+1 ) 2 70 2 =1; ( y+5 ) 2 7 2 − ( x+1 ) 2 70 2 =1; vertices: ( −1,2 ),( −1,−12 ); ( −1,2 ),( −1,−12 ); foci: ( −1,−5+7 101 ),( −1,−5−7 101 ); ( −1,−5+7 101 ),( −1,−5−7 101 ); asymptotes: y= 1 10 ( x+1 )−5,y=− 1 10 ( x+1 )−5 y= 1 10 ( x+1 )−5,y=− 1 10 ( x+1 )−5

25.

( x+3 ) 2 5 2 − ( y−4 ) 2 2 2 =1; ( x+3 ) 2 5 2 − ( y−4 ) 2 2 2 =1; vertices: ( 2,4 ),( −8,4 ); ( 2,4 ),( −8,4 ); foci: ( −3+ 29 ,4 ),( −3− 29 ,4 ); ( −3+ 29 ,4 ),( −3− 29 ,4 ); asymptotes: y= 2 5 ( x+3 )+4,y=− 2 5 ( x+3 )+4 y= 2 5 ( x+3 )+4,y=− 2 5 ( x+3 )+4

27.

y= 2 5 ( x−3 )−4,y=− 2 5 ( x−3 )−4 y= 2 5 ( x−3 )−4,y=− 2 5 ( x−3 )−4

29.

y= 3 4 ( x−1 )+1,y=− 3 4 ( x−1 )+1 y= 3 4 ( x−1 )+1,y=− 3 4 ( x−1 )+1

31.
The image shows a hyperbola centered at the origin, opening to the left and right. Its vertices are labeled at (-7,0) and (7,0), while its foci are labeled at approximately (-8.06,0) and (8.06,0). The graph is set against a grid with x-axis values ranging from -20 to 20 and y-axis values from -10 to 10.
33.
A graph shows a hyperbola centered at the origin. The transverse axis is along the y-axis. The vertices are labeled at (0, 3) and (0, -3). The foci are labeled at (0, 5.83) and (0, -5.83).
35.
A graph of a vertically oriented hyperbola. Vertices are (4, -2) and (4, -8). Foci are (4, 0.83) and (4, -10.83).
37.
A hyperbola graph with vertices labeled at (3, 0) and (3, 6), and foci at (3, -1.24) and (3, 7.24). The branches open upwards and downwards along the y-axis.
39.
A graph on a coordinate plane shows a hyperbola with its center at (4, -2). The two vertices are labeled at (-1, -2) and (9, -2). The two foci are labeled at approximately (-1.1, -2) and (9.1, -2). The hyperbola opens horizontally, with its branches extending to the left from the vertex at (-1, -2) and to the right from the vertex at (9, -2). The x-axis ranges from -20 to 20, and the y-axis ranges from -10 to 10.
41.
A graph shows a hyperbola on a coordinate plane. The x-axis ranges from -20 to 20 and the y-axis ranges from -10 to 10. The hyperbola has two branches opening horizontally, one to the left and one to the right. The left vertex is labeled as (-4, -4) and the right vertex is labeled as (2, -4). The left focus is labeled as (-9.54, -4) and the right focus is labeled as (7.54, -4).
43.
A Cartesian coordinate system displays two parabolas. The top parabola opens upwards, with its vertex marked at (5, 15) and its focus marked at (5, 15.05). The bottom parabola opens downwards, with its vertex marked at (5, -5) and its focus marked at (5, -5.05). Both parabolas share the vertical line x=5 as their axis of symmetry. The x-axis spans from -16 to 16, and the y-axis spans from -24 to 24.
45.

x 2 9 − y 2 16 =1 x 2 9 − y 2 16 =1

47.

( x−6 ) 2 25 − ( y−1 ) 2 11 =1 ( x−6 ) 2 25 − ( y−1 ) 2 11 =1

49.

( x−4 ) 2 25 − ( y−2 ) 2 1 =1 ( x−4 ) 2 25 − ( y−2 ) 2 1 =1

51.

y 2 16 − x 2 25 =1 y 2 16 − x 2 25 =1

53.

y 2 9 − ( x+1 ) 2 9 =1 y 2 9 − ( x+1 ) 2 9 =1

55.

( x+3 ) 2 25 − ( y+3 ) 2 25 =1 ( x+3 ) 2 25 − ( y+3 ) 2 25 =1

57.

y( x )=3 x 2 +1 ,y( x )=−3 x 2 +1 y( x )=3 x 2 +1 ,y( x )=−3 x 2 +1

A graph showing two parabolas. The upper parabola opens upwards with its vertex at (0, 3), and the lower parabola opens downwards with its vertex at (0, -3). Both are symmetric about the y-axis.
59.

y( x )=1+2 x 2 +4x+5 ,y( x )=1−2 x 2 +4x+5 y( x )=1+2 x 2 +4x+5 ,y( x )=1−2 x 2 +4x+5

A graph on a Cartesian coordinate system with x- and y-axes ranging from -10 to 10. The graph displays two curves. The upper curve opens upwards, with its vertex at approximately (-2, 3), and extends to the upper left and upper right. The lower curve opens downwards, with its vertex at approximately (-2, -1), and extends to the lower left and lower right. Both curves appear to be parabolas, suggesting a conic section or a pair of quadratic functions.
61.

x 2 25 − y 2 25 =1 x 2 25 − y 2 25 =1

A Cartesian coordinate system with x and y axes ranging from -15 to 15. A hyperbola with horizontal branches is plotted, with its vertices at approximately x = -4 and x = 4. The origin (0,0) is marked with an open circle and labeled "Fountain" with an arrow pointing to it.
63.

x 2 100 − y 2 25 =1 x 2 100 − y 2 25 =1

A graph displays a hyperbola centered at the origin, labeled "Fountain". The hyperbola opens horizontally, symmetric about the x-axis, with its vertices on the x-axis.
65.

x 2 400 − y 2 225 =1 x 2 400 − y 2 225 =1

A graph displays a hyperbola centered at the origin (0,0), labeled "Fountain". The hyperbola opens horizontally, with its two branches extending outwards from approximate x-intercepts at (-20,0) and (20,0).
67.

4(x-1)2-y22=16 4(x-1)2-y22=16

69.

( x−h ) 2 a2 - (y-k)2 b2 =(x-3)2-9y2=4 ( x−h ) 2 a2 -(y-k)2 b2=(x-3)2-9y2=4

8.3 Section Exercises

1.

A parabola is the set of points in the plane that lie equidistant from a fixed point, the focus, and a fixed line, the directrix.

3.

The graph will open down.

5.

The distance between the focus and directrix will increase.

7.

yes x2=4(116)y x2=4(116)y

9.

yes ( y−3 ) 2 =4(2)( x−2 ) ( y−3 ) 2 =4(2)( x−2 )

11.

y 2 = 1 8 x,V:(0,0);F:( 1 32 ,0 );d:x=− 1 32 y 2 = 1 8 x,V:(0,0);F:( 1 32 ,0 );d:x=− 1 32

13.

x 2 =− 1 4 y,V:( 0,0 );F:( 0,− 1 16 );d:y= 1 16 x 2 =− 1 4 y,V:( 0,0 );F:( 0,− 1 16 );d:y= 1 16

15.

y 2 = 1 36 x,V:( 0,0 );F:( 1 144 ,0 );d:x=− 1 144 y 2 = 1 36 x,V:( 0,0 );F:( 1 144 ,0 );d:x=− 1 144

17.

( x−1 ) 2 =4( y−1 ),V:( 1,1 );F:( 1,2 );d:y=0 ( x−1 ) 2 =4( y−1 ),V:( 1,1 );F:( 1,2 );d:y=0

19.

( y−4 ) 2 =2( x+3 ),V:( −3,4 );F:( − 5 2 ,4 );d:x=− 7 2 ( y−4 ) 2 =2( x+3 ),V:( −3,4 );F:( − 5 2 ,4 );d:x=− 7 2

21.

( x+4 ) 2 =24( y+1 ),V:( −4,−1 );F:( −4,5 );d:y=−7 ( x+4 ) 2 =24( y+1 ),V:( −4,−1 );F:( −4,5 );d:y=−7

23.

( y−3 ) 2 =−12( x+1 ),V:( −1,3 );F:( −4,3 );d:x=2 ( y−3 ) 2 =−12( x+1 ),V:( −1,3 );F:( −4,3 );d:x=2

25.

( x−5 ) 2 = 4 5 ( y+3 ),V:( 5,−3 );F:( 5,− 14 5 );d:y=− 16 5 ( x−5 ) 2 = 4 5 ( y+3 ),V:( 5,−3 );F:( 5,− 14 5 );d:y=− 16 5

27.

( x−2 ) 2 =−2( y−5 ),V:( 2,5 );F:( 2, 9 2 );d:y= 11 2 ( x−2 ) 2 =−2( y−5 ),V:( 2,5 );F:( 2, 9 2 );d:y= 11 2

29.

( y−1 ) 2 = 4 3 ( x−5 ),V:( 5,1 );F:( 16 3 ,1 );d:x= 14 3 ( y−1 ) 2 = 4 3 ( x−5 ),V:( 5,1 );F:( 16 3 ,1 );d:x= 14 3

31.
A graph of a parabola shown on a coordinate plane, with its focus at (2, 0) marked by a green dot and its directrix as the vertical orange line x = -2.
33.
A graph showing a parabola opening upwards, with its vertex at the origin (0,0). The focus is located at (0,9) and labeled "Focus (0,9)". The directrix is a horizontal line at y = -9, labeled "y = -9". The x-axis ranges from -32 to 32, and the y-axis ranges from -24 to 24, both with tick marks every 8 units.
35.
A graph displays a parabola opening to the left. The focus is marked at (-7/3, 2). The directrix is a vertical line at x = -5/3. The x-axis ranges from -10 to 5, and the y-axis ranges from -7.5 to 7.5.
37.
A parabola opening left is graphed with its focus at (23/6, -5) and its directrix as the vertical line x = 25/6, shown on a Cartesian coordinate plane.
39.
A Cartesian coordinate system shows a parabola opening downwards. The x-axis ranges from -20 to 10 and the y-axis from -20 to 10. The directrix of the parabola is indicated by an orange horizontal line labeled "y = 0", which coincides with the x-axis. The focus of the parabola is marked by a teal dot at coordinates (-4, -2) with an arrow pointing to it and labeled "Focus (-4, -2)". The vertex of the parabola is located at (-4, -1).
41.
A graph of a parabola plotted on a coordinate plane. The x-axis ranges from -10 to 15, and the y-axis ranges from -20 to 15. A blue curve represents the parabola, which opens horizontally to the right. A green dot marks the focus of the parabola at the coordinates (0, -5). An orange vertical line, labeled "x = -4", represents the directrix of the parabola.
43.
A graph displays a parabola opening to the right, with its directrix at x = 2 shown as a vertical orange line and its focus marked as a teal point at (8, -1).
45.

x 2 =−16y x 2 =−16y

47.

( y−2 ) 2 =4 2 ( x−2 ) ( y−2 ) 2 =4 2 ( x−2 )

49.

( y+ 3 ) 2 =−4 2 ( x− 2 ) ( y+ 3 ) 2 =−4 2 ( x− 2 )

51.

x 2 =y x 2 =y

53.

( y−2 ) 2 = 1 4 ( x+2 ) ( y−2 ) 2 = 1 4 ( x+2 )

55.

( y− 3 ) 2 =4 5 ( x+ 2 ) ( y− 3 ) 2 =4 5 ( x+ 2 )

57.

y 2 =−8x y 2 =−8x

59.

( y+1 ) 2 =12( x+3 ) ( y+1 ) 2 =12( x+3 )

61.

( 0,1 ) ( 0,1 )

63.

At the point 2.25 feet above the vertex.

65.

0.5625 feet

67.

x 2 =−125( y−20 ), x 2 =−125( y−20 ), height is 7.2 feet

69.

2304 feet

8.4 Section Exercises

1.

The xy xy term causes a rotation of the graph to occur.

3.

The conic section is a hyperbola.

5.

It gives the angle of rotation of the axes in order to eliminate the xy xy term.

7.

AB=0, AB=0, parabola

9.

AB=−4<0, AB=−4<0, hyperbola

11.

AB=6>0, AB=6>0, ellipse

13.

B 2 −4AC=0, B 2 −4AC=0, parabola

15.

B 2 −4AC=0, B 2 −4AC=0, parabola

17.

B 2 −4AC=−96<0, B 2 −4AC=−96<0, ellipse

19.

7 x ′ 2 +9 y ′ 2 −4=0 7 x ′ 2 +9 y ′ 2 −4=0

21.

3 x ′ 2 +2 x ′ y ′ −5 y ′ 2 +1=0 3 x ′ 2 +2 x ′ y ′ −5 y ′ 2 +1=0

23.

θ= 60 ∘ ,11 x ′ 2 − y ′ 2 + 3 x ′ + y ′ −4=0 θ= 60 ∘ ,11 x ′ 2 − y ′ 2 + 3 x ′ + y ′ −4=0

25.

θ= - 30 ∘ ,21 x ′ 2 +9 y ′ 2 +4 x ′ −4 3 y ′ −6=0 θ= - 30 ∘ ,21 x ′ 2 +9 y ′ 2 +4 x ′ −4 3 y ′ −6=0

27.

θ≈ 36.9 ∘ ,125 x ′ 2 +6 x ′ −42 y ′ +10=0 θ≈ 36.9 ∘ ,125 x ′ 2 +6 x ′ −42 y ′ +10=0

29.

θ= 45 ∘ ,3 x ′ 2 − y ′ 2 − 2 x ′ + 2 y ′ +1=0 θ= 45 ∘ ,3 x ′ 2 − y ′ 2 − 2 x ′ + 2 y ′ +1=0

31.

2 2 ( x ′ + y ′ )= 1 2 ( x ′ − y ′ ) 2 2 2 ( x ′ + y ′ )= 1 2 ( x ′ − y ′ ) 2

A coordinate plane displays two parabolas with their vertices at the origin. A blue parabola opens downwards, and an orange parabola opens to the left.
33.

( x ′ − y ′ ) 2 8 + ( x ′ + y ′ ) 2 2 =1 ( x ′ − y ′ ) 2 8 + ( x ′ + y ′ ) 2 2 =1

A coordinate plane shows two intersecting ellipses. One is blue and appears more horizontally oriented, while the other is orange and appears more vertically oriented. Both are centered near the origin.
35.

( x ′ + y ′ ) 2 2 − ( x ′ − y ′ ) 2 2 =1 ( x ′ + y ′ ) 2 2 − ( x ′ − y ′ ) 2 2 =1

A graph displays two hyperbolas centered at the origin on a Cartesian coordinate plane. One hyperbola, shown in orange, opens horizontally, while the other, in blue, opens vertically.
37.

3 2 x ′ − 1 2 y ′ = ( 1 2 x ′ + 3 2 y ′ −1 ) 2 3 2 x ′ − 1 2 y ′ = ( 1 2 x ′ + 3 2 y ′ −1 ) 2

A graph displays two parabolas. The blue parabola opens to the right with its vertex at the origin (0,0). The orange parabola opens downwards with its vertex at (2,1).
39.
This graph illustrates two hyperbolas rotated by 45 degrees. The blue hyperbola opens left and right, with vertices at ( 3 2 , 0) and (- 3 2 , 0). The orange hyperbola opens up and down, passing through (3, 3) and (-3, -3).
41.
A graph of a hyperbola rotated by 45 degrees. The x-axis and y-axis both range from -10 to 10. The vertices of the hyperbola are at (-2, 0) and (2, 0). The foci are indicated at (negative square root of 2 over 2, square root of 2 over 2) and (square root of 2 over 2, negative square root of 2 over 2). The rotation angle is labeled as theta = 45 degrees.
43.
Two ellipses are shown on a coordinate plane. The blue ellipse is centered at the origin, and the orange ellipse is rotated by 30 degrees. Their intersection points are labeled.
45.
Two ellipses on a coordinate plane. Blue ellipse is axis-aligned with x-intercepts (+/- sqrt(9/16), 0). Orange ellipse is rotated 30 degrees, with points (-1/2, sqrt(3)/2) and (1/2, -sqrt(3)/2) labeled.
47.
Two parabolic paths, starting at (0,0), are plotted on an x-y plane. The blue path goes downwards, and the orange path moves right and down. An angle of 37° is indicated.
49.
A coordinate plane displays two parabolas starting at (0,0). The blue parabola opens along the positive x-axis. The orange parabola is rotated by an angle "theta" = 63 degrees.
51.

θ= 45 ∘ θ= 45 ∘

A graph on a Cartesian coordinate system shows the x-axis and y-axis, each ranging from -5 to 5. Two dashed lines are drawn, both passing through the origin. One dashed line is labeled y' and goes from top-left to bottom-right, representing the equation y = -x. The other dashed line is labeled x' and goes from bottom-left to top-right, representing the equation y = x. These dashed lines illustrate a rotation of the coordinate axes.
53.

θ= 60 ∘ θ= 60 ∘

A Cartesian coordinate system with original x and y axes and two dashed lines, x' and y', both passing through the origin. x' has a positive slope, and y' has a negative slope.
55.

θ≈ 36.9 ∘ θ≈ 36.9 ∘

A graph illustrating two sets of coordinate axes, (x, y) and a rotated set (x', y'), both intersecting at the origin. The x' and y' axes are shown as dashed orange lines.
57.

−4 6 <k<4 6 −4 6 <k<4 6

59.

k=2 k=2

8.5 Section Exercises

1.

If eccentricity is less than 1, it is an ellipse. If eccentricity is equal to 1, it is a parabola. If eccentricity is greater than 1, it is a hyperbola.

3.

The directrix will be parallel to the polar axis.

5.

One of the foci will be located at the origin.

7.

Parabola with e=1 e=1 and directrix 3 4 3 4 units below the pole.

9.

Hyperbola with e=2 e=2 and directrix 5 2 5 2 units above the pole.

11.

Parabola with e=1 e=1 and directrix 3 10 3 10 units to the right of the pole.

13.

Ellipse with e= 2 7 e= 2 7 and directrix 2 2 units to the right of the pole.

15.

Hyperbola with e= 5 3 e= 5 3 and directrix 11 5 11 5 units above the pole.

17.

Hyperbola with e= 8 7 e= 8 7 and directrix 7 8 7 8 units to the right of the pole.

19.

25 x 2 +16 y 2 −12y−4=0 25 x 2 +16 y 2 −12y−4=0

21.

21 x 2 −4 y 2 −30x+9=0 21 x 2 −4 y 2 −30x+9=0

23.

64 y 2 =48x+9 64 y 2 =48x+9

25.

96 y 2 −25 x 2 +110y+25=0 96 y 2 −25 x 2 +110y+25=0

27.

3 x 2 +4 y 2 −2x−1=0 3 x 2 +4 y 2 −2x−1=0

29.

5 x 2 +9 y 2 −24x−36=0 5 x 2 +9 y 2 −24x−36=0

31.
An ellipse with vertices at (-5,0), (5/3,0), (-1.67, 2.89), (-1.67, -2.89) and foci at (-10/3, 0) and (0,0) is shown on a Cartesian grid.
33.
A graph of an ellipse on a Cartesian coordinate system with its four vertices labeled as (0, 10), (0, -10/9), (-30/9, 40/9), (40/9, 30/9), and two foci at (0, 80/9) and (0, 0).
35.
A hyperbola graph with foci (0,0) and (-80/9,0) and vertices (-8/9,0) and (-8,0). The branches open left and right along the x-axis.
37.
A graph displays an upward-opening parabola with its vertex at (0, -1), focus at (0, 0), and directrix at y = -2. The x-axis ranges from -5 to 5, and the y-axis from -3 to 3.
39.
A graph of a parabola is shown on a coordinate plane. The x-axis extends from -16 to 10, and the y-axis extends from -16 to 16. The parabola opens to the left, passing through the origin of the y-axis at approximately y=4.47 and y=-4.47, and through the x-axis at 5/2 (which is 2.5). The focus of the parabola is a green dot located at the origin (0,0) and labeled "Focus (0, 0)". The vertex of the parabola is a blue dot located at (5/2, 0) and labeled "Vertex (5/2, 0)". The directrix of the parabola is a vertical orange line at x=5, labeled "x = 5".
41.
A graph displays an ellipse on a coordinate plane. The ellipse is vertically oriented. Its vertices are labeled as (0, 6), (0, -6/5), (-2.68, 2.4), and (2.68, 2.4). The foci are labeled as (0, 24/5) and (0, 0).
43.

r= 4 5+cosθ r= 4 5+cosθ

45.

r= 4 1+2sinθ r= 4 1+2sinθ

47.

r= 1 1+cosθ r= 1 1+cosθ

49.

r= 7 8−28cosθ r= 7 8−28cosθ

51.

r= 12 2+3sinθ r= 12 2+3sinθ

53.

r= 15 4−3cosθ r= 15 4−3cosθ

55.

r= 3 3−3cosθ r= 3 3−3cosθ

57.

r=± 2 1+sinθcosθ r=± 2 1+sinθcosθ

59.

r=± 2 4cosθ+3sinθ r=± 2 4cosθ+3sinθ

Review Exercises

1.

x 2 5 2 + y 2 8 2 =1; x 2 5 2 + y 2 8 2 =1; center: ( 0,0 ); ( 0,0 ); vertices: ( 5,0 ),( −5,0 ),( 0,8 ),( 0,−8 ); ( 5,0 ),( −5,0 ),( 0,8 ),( 0,−8 ); foci: ( 0, 39 ),( 0,− 39 ) ( 0, 39 ),( 0,− 39 )

3.

(x+3) 2 1 2 + (y−2) 2 3 2 =1(−3,2);(−2,2),(−4,2),(−3,5),(−3,−1);( −3,2+2 2 ),( −3,2−2 2 ) (x+3) 2 1 2 + (y−2) 2 3 2 =1(−3,2);(−2,2),(−4,2),(−3,5),(−3,−1);( −3,2+2 2 ),( −3,2−2 2 )

5.

center: ( 0,0 ); ( 0,0 ); vertices: ( 6,0 ),( −6,0 ),( 0,3 ),( 0,−3 ); ( 6,0 ),( −6,0 ),( 0,3 ),( 0,−3 ); foci: ( 3 3 ,0 ),( −3 3 ,0 ) ( 3 3 ,0 ),( −3 3 ,0 )

A blue ellipse is plotted on a grid. It is centered at the origin (0,0) and extends horizontally from x=-5.5 to x=5.5 and vertically from y=-3 to y=3.
7.

center: ( −2,−2 ); ( −2,−2 ); vertices: ( 2,−2 ),( −6,−2 ),( −2,6 ),( −2,−10 ); ( 2,−2 ),( −6,−2 ),( −2,6 ),( −2,−10 ); foci: ( −2,−2+4 3 , ),( −2,−2−4 3 ) ( −2,−2+4 3 , ),( −2,−2−4 3 )

A blue ellipse is shown on a coordinate plane with x-axis ranging from -20 to 20 and y-axis from -15 to 15. The ellipse is vertically oriented, centered at (0, -2.5), with its widest points at approximately x = -2.5 and x = 2.5, and its highest and lowest points at y = 5 and y = -10, respectively.
9.

x 2 25 + y 2 16 =1 x 2 25 + y 2 16 =1

11.

Approximately 35.71 feet

13.

( y+1 ) 2 4 2 − ( x−4 ) 2 6 2 =1; ( y+1 ) 2 4 2 − ( x−4 ) 2 6 2 =1; center: ( 4,−1 ); ( 4,−1 ); vertices: ( 4,3 ),( 4,−5 ); ( 4,3 ),( 4,−5 ); foci: ( 4,−1+2 13 ),( 4,−1−2 13 ) ( 4,−1+2 13 ),( 4,−1−2 13 )

15.

( x−2 ) 2 2 2 − ( y+3 ) 2 ( 2 3 ) 2 =1; ( x−2 ) 2 2 2 − ( y+3 ) 2 ( 2 3 ) 2 =1; center: ( 2,−3 ); ( 2,−3 ); vertices: ( 4,−3 ),( 0,−3 ); ( 4,−3 ),( 0,−3 ); foci: ( 6,−3 ),( −2,−3 ) ( 6,−3 ),( −2,−3 )

17.


A graph displays a hyperbola centered at (-1, 1). The two vertices are at (-1, 8) and (-1, -6). The two foci are at (-1, 8.28) and (-1, -6.28).
19.


This graph illustrates a hyperbola with a vertical transverse axis, showing its two branches, vertices at (0, 6.46) and (0, -0.46), and foci at (0, 9) and (0, -3).
21.

( x−5 ) 2 1 − ( y−7 ) 2 3 =1 ( x−5 ) 2 1 − ( y−7 ) 2 3 =1

23.

( x+2 ) 2 = 1 2 ( y−1 ); ( x+2 ) 2 = 1 2 ( y−1 ); vertex: ( −2,1 ); ( −2,1 ); focus: ( −2, 9 8 ); ( −2, 9 8 ); directrix: y= 7 8 y= 7 8

25.

( x+5 ) 2 =( y+2 ); ( x+5 ) 2 =( y+2 ); vertex: ( −5,−2 ); ( −5,−2 ); focus: ( −5,− 7 4 ); ( −5,− 7 4 ); directrix: y=− 9 4 y=− 9 4

27.


A graph on a coordinate plane displays a parabola opening to the right. The vertex of the parabola is marked at (-3, 1). The focus is labeled as the point (-23/8, 1). A vertical orange line, representing the directrix, is shown at x = -25/8. The x-axis ranges from -5 to 5, and the y-axis ranges from -3 to 3, with major grid lines at integer values.
29.


A graph displays a horizontal parabola opening left, with its vertex at (1/2, -3), focus at (-1/4, -3), and a vertical directrix line represented by x = 5/4.
31.

( x−2 ) 2 =( 1 2 )( y−1 ) ( x−2 ) 2 =( 1 2 )( y−1 )

33.

B 2 −4AC=0, B 2 −4AC=0, parabola

35.

B 2 −4AC=−31<0, B 2 −4AC=−31<0, ellipse

37.

θ= 45 ∘ , x ′ 2 +3 y ′ 2 −12=0 θ= 45 ∘ , x ′ 2 +3 y ′ 2 −12=0

39.

θ= 45 ∘ θ= 45 ∘

A graph on the Cartesian coordinate plane shows an ellipse centered at the origin (0,0). The x-axis extends from -4 to 4, and the y-axis extends from -4 to 4. The ellipse intersects the x-axis at (-2,0) and (2,0), and these points are explicitly labeled. The ellipse intersects the y-axis at (0,1) and (0,-1). The major axis of the ellipse lies along the x-axis and has a length of 4, while the minor axis lies along the y-axis and has a length of 2.
41.

Hyperbola with e=5 e=5 and directrix 2 2 units to the left of the pole.

43.

Ellipse with e= 3 4 e= 3 4 and directrix 1 3 1 3 unit above the pole.

45.


A graph illustrating a parabola opening upwards, with its focus at (0, 0), vertex at (0, -3/2), and a horizontal directrix line labeled y = -3.
47.


A horizontal hyperbola graph opens left and right. Its vertices are at (10/9, 0) and (10, 0), and its foci are at (0, 0) and (100/9, 0).
49.

r= 3 1+cos θ r= 3 1+cos θ

Practice Test

1.

x 2 3 2 + y 2 2 2 =1; x 2 3 2 + y 2 2 2 =1; center: ( 0,0 ); ( 0,0 ); vertices: ( 3,0 ),( –3,0 ),( 0,2 ),( 0,−2 ); ( 3,0 ),( –3,0 ),( 0,2 ),( 0,−2 ); foci: ( 5 ,0 ),( − 5 ,0 ) ( 5 ,0 ),( − 5 ,0 )

3.

center: ( 3,2 ); ( 3,2 ); vertices: ( 11,2 ),( −5,2 ),( 3,8 ),( 3,−4 ); ( 11,2 ),( −5,2 ),( 3,8 ),( 3,−4 ); foci: ( 3+2 7 ,2 ),( 3−2 7 ,2 ) ( 3+2 7 ,2 ),( 3−2 7 ,2 )

An ellipse is graphed on a Cartesian coordinate plane. The ellipse is centered at (3, 2) and extends horizontally from x = -4 to x = 10, and vertically from y = -3 to y = 7.
5.

( x−1 ) 2 36 + ( y−2 ) 2 27 =1 ( x−1 ) 2 36 + ( y−2 ) 2 27 =1

7.

x 2 7 2 − y 2 9 2 =1; x 2 7 2 − y 2 9 2 =1; center: ( 0,0 ); ( 0,0 ); vertices ( 7,0 ),( −7,0 ); ( 7,0 ),( −7,0 ); foci: ( 130 ,0 ),( − 130 ,0 ); ( 130 ,0 ),( − 130 ,0 ); asymptotes: y=± 9 7 x y=± 9 7 x

9.

center: ( 3,−3 ); ( 3,−3 ); vertices: ( 8,−3 ),( −2,−3 ); ( 8,−3 ),( −2,−3 ); foci: ( 3+ 26 ,−3 ),( 3− 26 ,−3 ); ( 3+ 26 ,−3 ),( 3− 26 ,−3 ); asymptotes: y=± 1 5 (x−3)−3 y=± 1 5 (x−3)−3

A graph plots a horizontal hyperbola opening left and right. The center is at (3, -3). Vertices are at (-2, -3) and (8, -3). Foci are at (3-sqrt(26), -3) and (3+sqrt(26), -3).
11.

( y−3 ) 2 1 − ( x−1 ) 2 8 =1 ( y−3 ) 2 1 − ( x−1 ) 2 8 =1

13.

( x−2 ) 2 = 1 3 ( y+1 ); ( x−2 ) 2 = 1 3 ( y+1 ); vertex: ( 2,−1 ); ( 2,−1 ); focus: ( 2,− 11 12 ); ( 2,− 11 12 ); directrix: y=− 13 12 y=− 13 12

15.


A graph displays a parabola plotted on a coordinate plane. The x-axis ranges from -20 to 10 and the y-axis from -15 to 15, with grid lines at intervals of 5. The parabola opens to the left. The vertex of the parabola is marked at (-3, 4) with a dark blue dot and labeled as "Vertex (-3, 4)". The focus is marked at (-5, 4) with a teal dot and labeled as "Focus (-5, 4)". A vertical orange line represents the directrix, which is the line x = -1, and is labeled as "x = -1".
17.

Approximately 8.49 8.49 feet

19.

parabola; θ≈ 63.4 ∘ θ≈ 63.4 ∘

21.

x ′ 2 −4 x ′ +3 y ′ =0 x ′ 2 −4 x ′ +3 y ′ =0

A Cartesian coordinate system displays a parabola that opens downwards. The x-axis is labeled from -6 to 6, and the y-axis is labeled from -6 to 6. The parabola passes through the origin (0,0) and appears to cross the x-axis again at x=4. Its vertex is indicated by a blue dot and labeled with the coordinates (2, 4/3). The curve extends infinitely downwards on both ends, indicated by arrows.
23.

Hyperbola with e= 3 2 , e= 3 2 , and directrix 5 6 5 6 units to the right of the pole.

25.
A downward-opening parabola is graphed. Its vertex is at (0, 1/4) and its focus is at (0, 0). The directrix is the horizontal line y = 1/2, shown above the vertex.