Which of the following are examples of time series data?
The vital statistics of a cancer patient taken right before a major surgery
The monthly expenses of a small company recorded over a period of five years
Daily temperature, rainfall, humidity, and wind speeds measured at a particular location over a few months
Student final grades in all sections of a course at a university
2.
Consider the graph in the figure as shown below.
a.
Is the trend curve generally increasing, decreasing, or staying level over the entire time period?
b.
The data set USATemps1961-2023.csv contains the time series from which the graph was created. Find the moving average trendline with period 10 for the data.
Figure 5.20
3.
a.
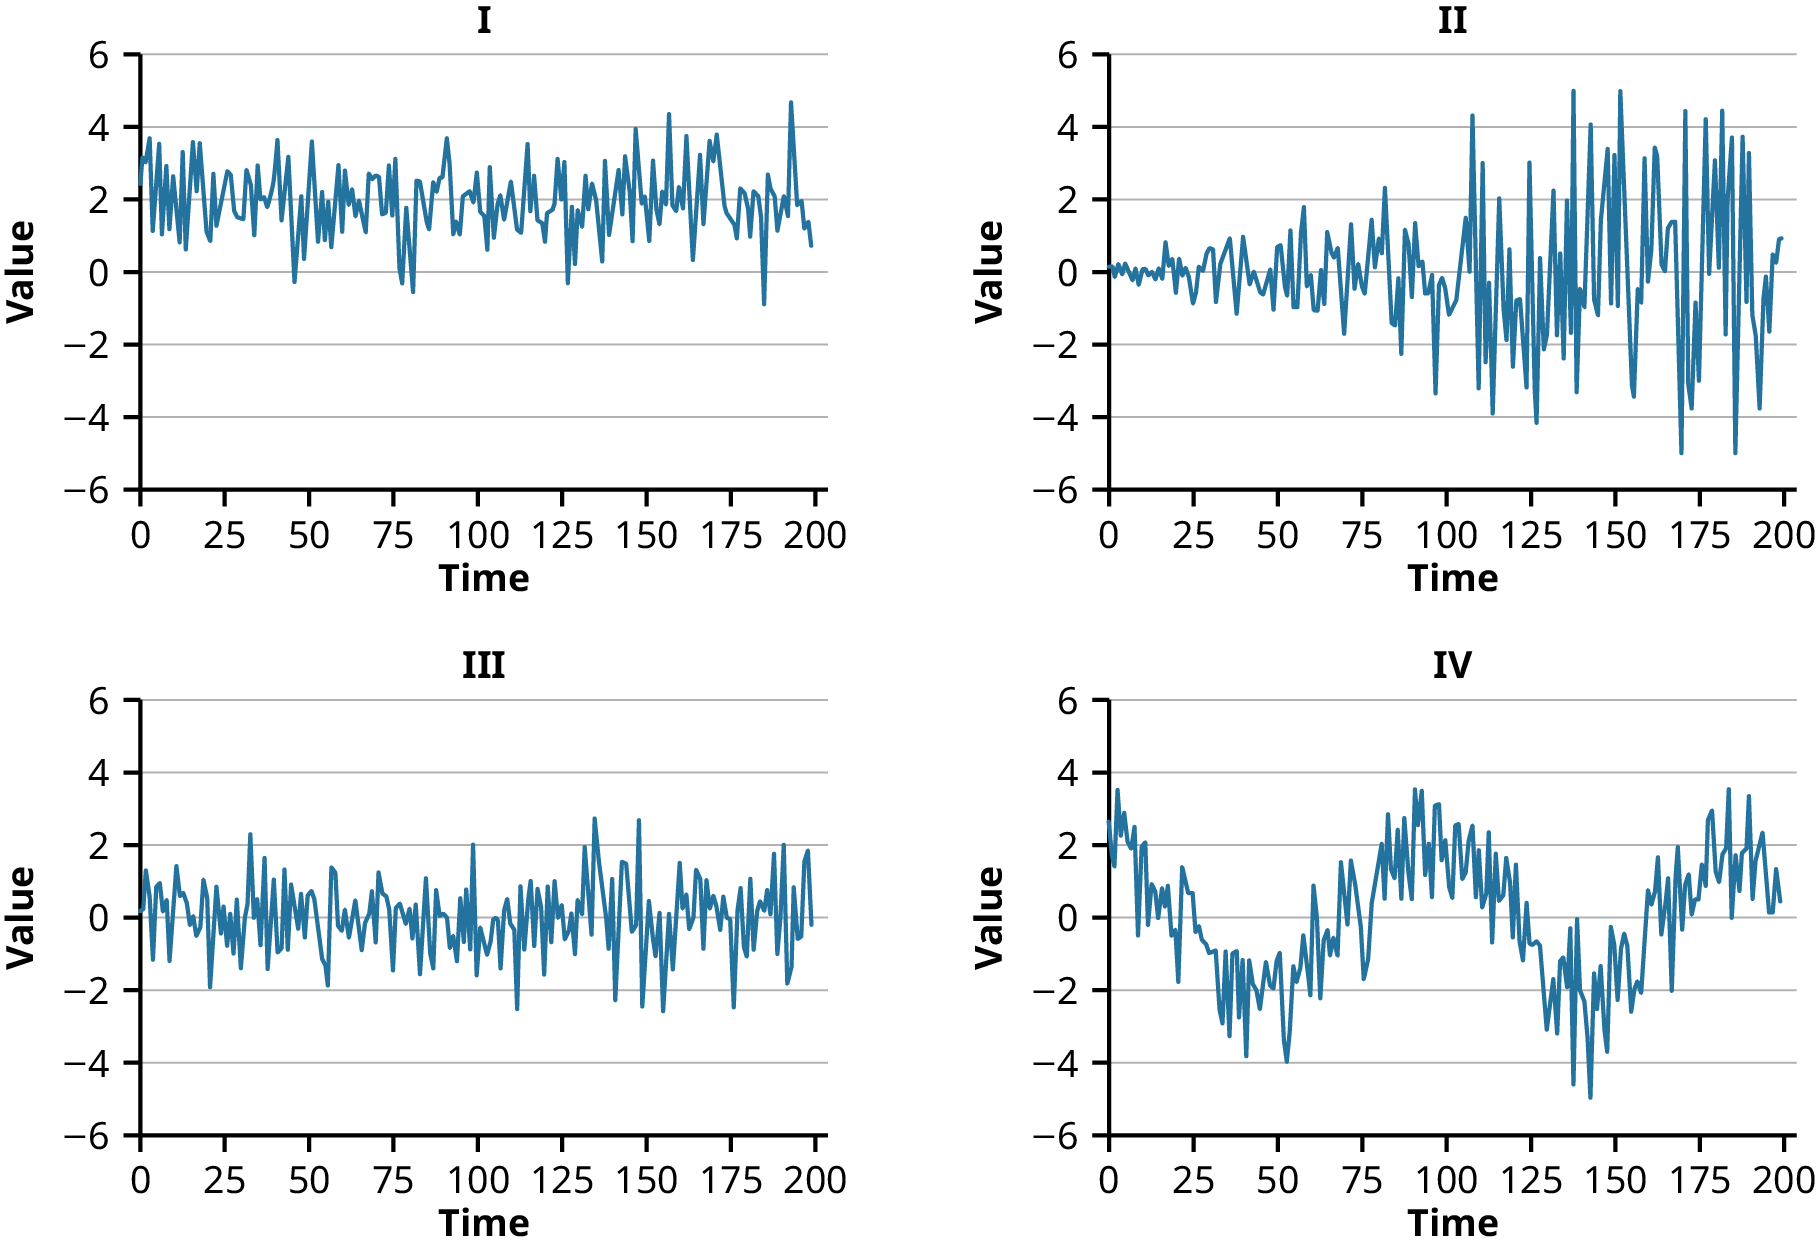
What are the characteristics of white noise? Why is it important that the residuals of a time series model be white noise?
b.
Determine which of the following graphs most likely represents white noise.
4.
Four time series models were produced to model a given dataset. Various measures of error were run on each of the models, the results of which are shown in the table.
MAE
RMSE
MAPE
Model 1
103.1
131.2
0.097
Model 2
251.7
207.9
0.136
Model 3
110.7
129.0
0.115
Model 4
89.8
125.3
0.191
Table 5.8Measures of Error
a.
Identify the most accurate model based only on:
MAE
RMSE
MAPE
b.
Which model is likely to produce the least accurate forecasts overall, and why?
c.
Which model is likely to produce the most accurate forecasts overall, and why?
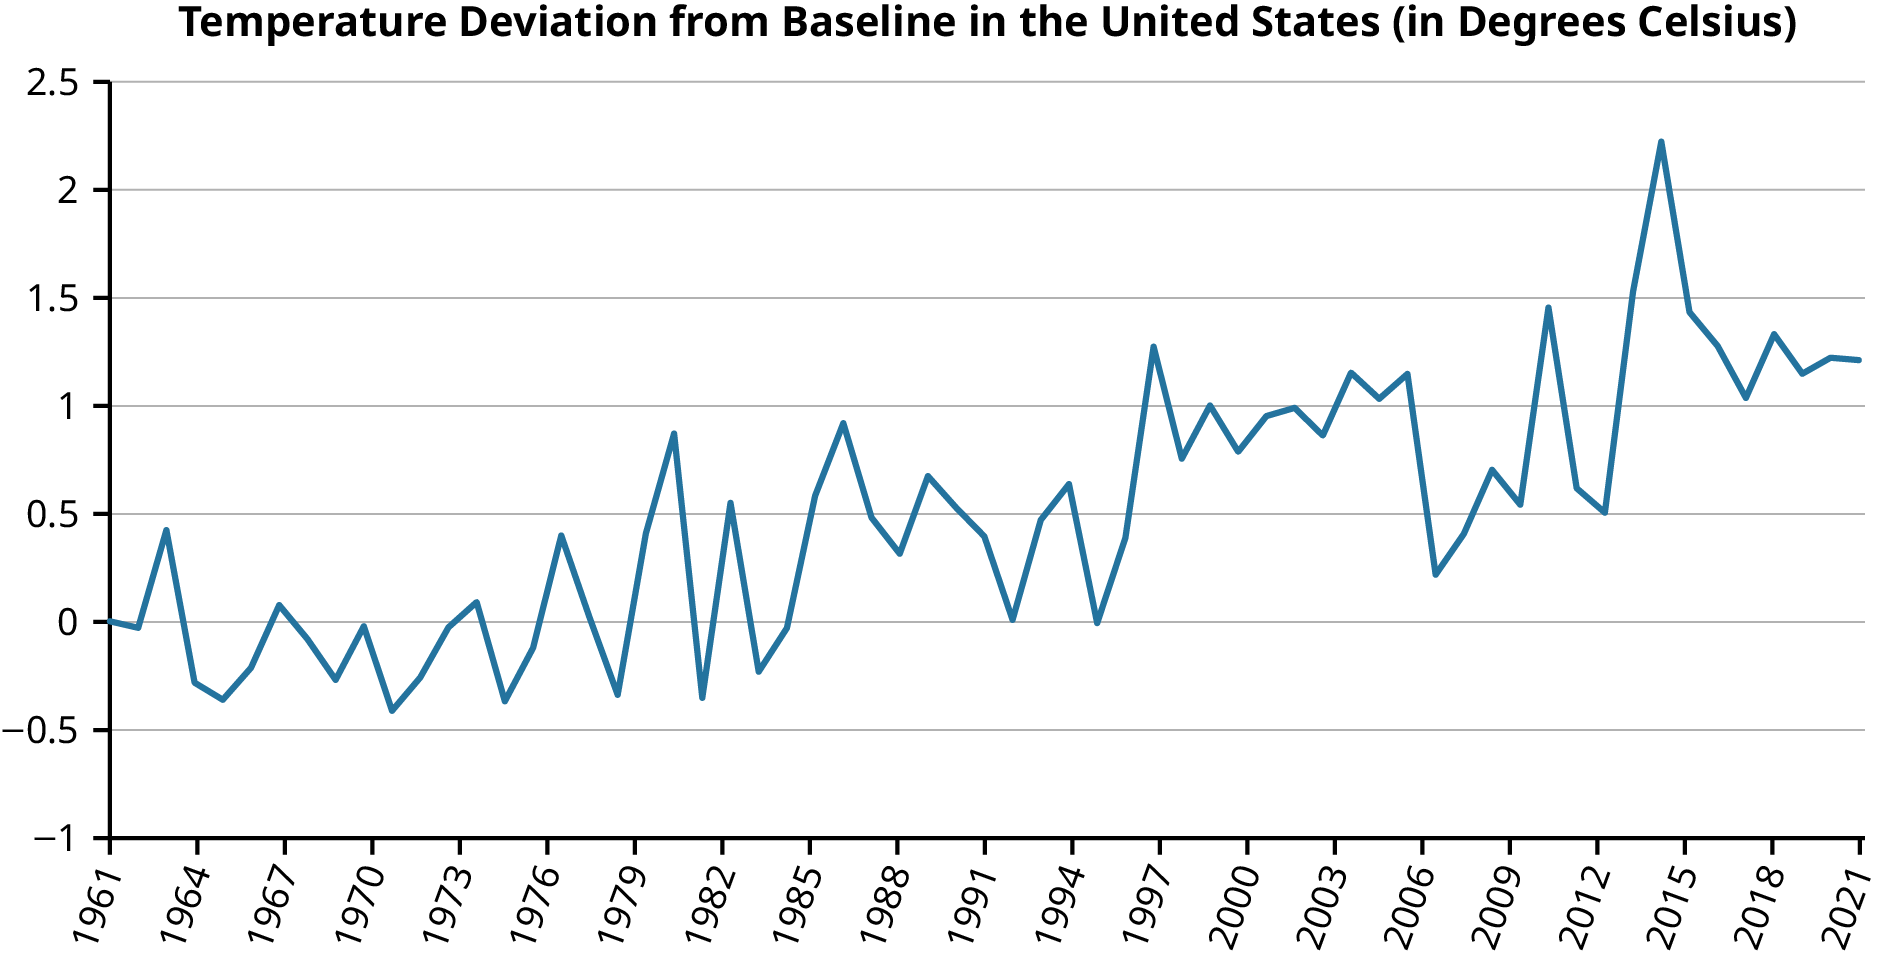 Figure 5.20